Monday, July 22, 2013

ERP SYSTEMS

Enterprise Resource Planning (ERP) SYSTEMS

Systems used to integrate internal and external management of information across an entire organization—embracing finance/accounting, manufacturing, sales and service, customer relationship management, etc. ERP systems automate this activity with an integrated software application. ERP facilitates information flow between all business functions inside the organization, and manages connections to outside stakeholders. 

Origin of "ERP"

In 1990 Gartner Group first employed the acronym ERP as an extension of material requirements planning (MRP), later manufacturing resource planning and computer-integrated manufacturing

Expansion

ERP systems initially focused on automating back office functions that did not directly affect customers and the general public. Front office functions, such as customer relationship management (CRM), dealt directly with customers, or e–business systems such as e–commerce, e–government, e–telecom, and e–finance—or supplier relationship management (SRM) became integrated later, when the Internet simplified communicating with external parties.


Thursday, July 18, 2013

TRAPPING

TRAPPING

 Trapping is a term most commonly used in the prepress industry to describe the compensation for misregistration between printing units on a multicolor press. This misregistration causes unsightly gaps or white-space on the final printed work. Trapping involves creating overlaps (spreads) or underlaps (chokes) of objects during the print production process to eliminate misregistration on the press.


Trapping Directions

It is important to know that the darker color always keeps its shape. The neutral density of a color is used to determine its darkness.[2]
The lighter color can trap the darker color in the following directions:
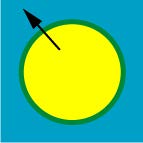
  • Choke: The yellow square makes the cyan circle in the middle smaller.
Choke
  • Spread: The yellow circle becomes bigger.
Spread
  • Centerline: Both Spread and Choke are applied (rarely used).
Centerline

CIE XYZ color space

CIE XYZ color space

Main article: CIE 1931 color space
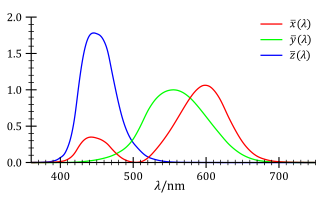
CIE 1931 Standard Colorimetric Observer functions between 380 nm and 780 nm (at 5 nm intervals).
One of the first mathematically defined color spaces is the CIE XYZ color space (also known as CIE 1931 color space), created by the International Commission on Illumination in 1931. These data were measured for human observers and a 2-degree field of view. In 1964, supplemental data for a 10-degree field of view were published.
Note that the tabulated sensitivity curves have a certain amount of arbitrariness in them. The shapes of the individual X, Y and Z sensitivity curves can be measured with a reasonable accuracy. However, the overall luminosity function (which in fact is a weighted sum of these three curves) is subjective, since it involves asking a test person whether two light sources have the same brightness, even if they are in completely different colors. Along the same lines, the relative magnitudes of the X, Y, and Z curves are arbitrary. One could as well define a valid color space with an X sensitivity curve that has twice the amplitude. This new color space would have a different shape. The sensitivity curves in the CIE 1931 and 1964 xyz color space are scaled to have equal areas under the curves.
Sometimes XYZ colors are represented by the luminance, Y, and chromaticity coordinates x and y, defined by:
\begin{align}
  x &= \frac{X}{X + Y + Z} \\
  y &= \frac{Y}{X + Y + Z}
\end{align}
Mathematically, x and y are projective coordinates and the colors of the chromaticity diagram occupy a region of the real projective plane. Because the CIE sensitivity curves have equal areas under the curves, light with a flat energy spectrum corresponds to the point (x,y) = (0.333,0.333).
The values for X, Y, and Z are obtained by integrating the product of the spectrum of a light beam and the published color-matching functions.

CIE-LAB COLOR SPACE

CIELAB, Lab, L*a*b

Color space defined by the CIE, based on one channel for Luminance (lightness) (L) and two color channels (a and b).

One problem with the XYZ color system, is that colorimetric distances between the individual colors do not correspond to perceived color differences. For example, in the figure above, a difference between green and greenish-yellow is relatively large, whereas the distance distinguishing blue and red is quite small. The CIE solved this problem in 1976 with the development of the three-dimensional Lab color space (or CIELAB color space).

In this model, the color differences which you perceive correspond to distances when measured colorimetrically. The a axis extends from green (-a) to red (+a) and the b axis from blue (-b) to yellow (+b). The brightness (L) increases from the bottom to the top of the three-dimensional model. (From www.linocolor.com)
Figure: The CIELAB color space (from www.linocolor.com)


This color space is better suited to many digital image manipulations than the RGB space, which is typically used in image editing programs. For example, the Lab space is useful for sharpening images and the removing artifacts in JPEG images or in images from digital cameras and scanners.